
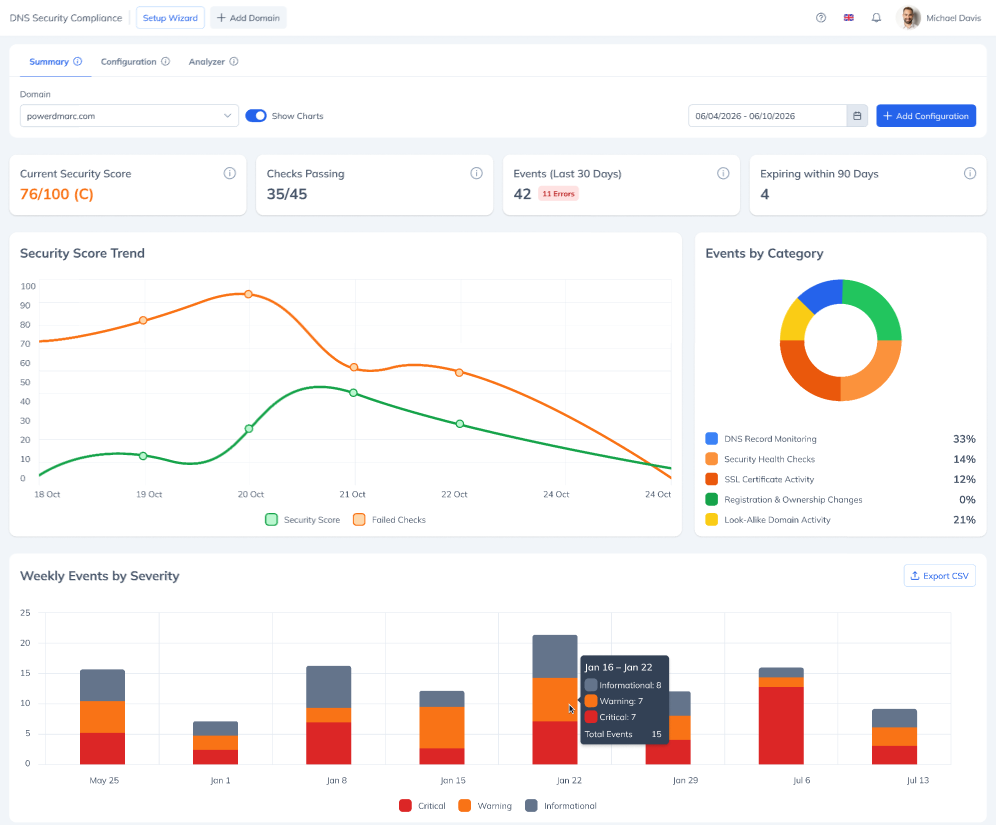
DNS Security Compliance continuously monitors your domains for DNS misconfigurations, SSL/TLS weaknesses, DNSSEC issues, registration and ownership changes, and look-alike domain activity. It runs a 46-check security scan against each monitored domain, assigns an A–F grade, and alerts you when something changes. The feature has three tabs: Summary (day-to-day monitoring view — score, failing checks, event feed, expiration calendar), Configuration (where you turn monitoring on for domains and choose which events fire alerts), and Analyzer (an on-demand scan you can run against any domain, monitored or not). This article focuses on the Configuration tab — how to set up monitoring for one or many domains.
Why this matters: Instead of manually tracking DNS records, SSL certificates, and domain renewals across separate tools, DNS Security Compliance gives you one guided setup that covers all of it — with a curated default event set so you don’t have to reason through the full catalog before going live.
How to Configure DNS Security Compliance
Configuring monitoring means creating a configuration — a set of Domains and/or Domain Groups, paired with the events that should trigger alerts, and (optionally) a notification group to route those alerts to. Each configuration is created and edited through a 4-step wizard.
1. Open the Configuration Wizard
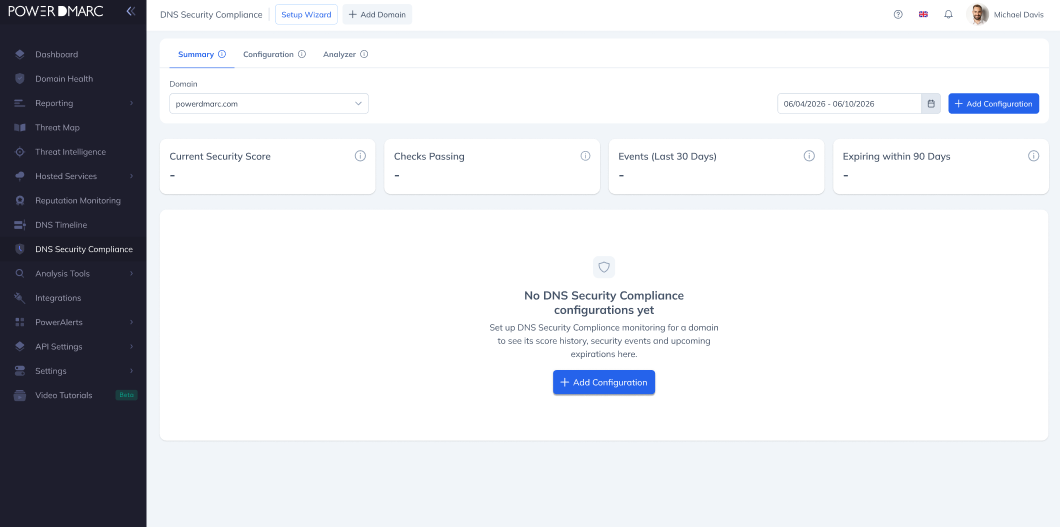
Navigate to DNS Security Compliance > Configuration.
If no configurations exist yet, the tab shows an empty landing state. Click + Add Configuration to open the wizard.
If configurations already exist, you’ll land on the list view instead (see Managing Existing Configurations below). Click + Add Configuration at the top-right of the table, or click + Add Domain in the page header, to open the wizard.
2. Step 1 — Select Monitoring Entities
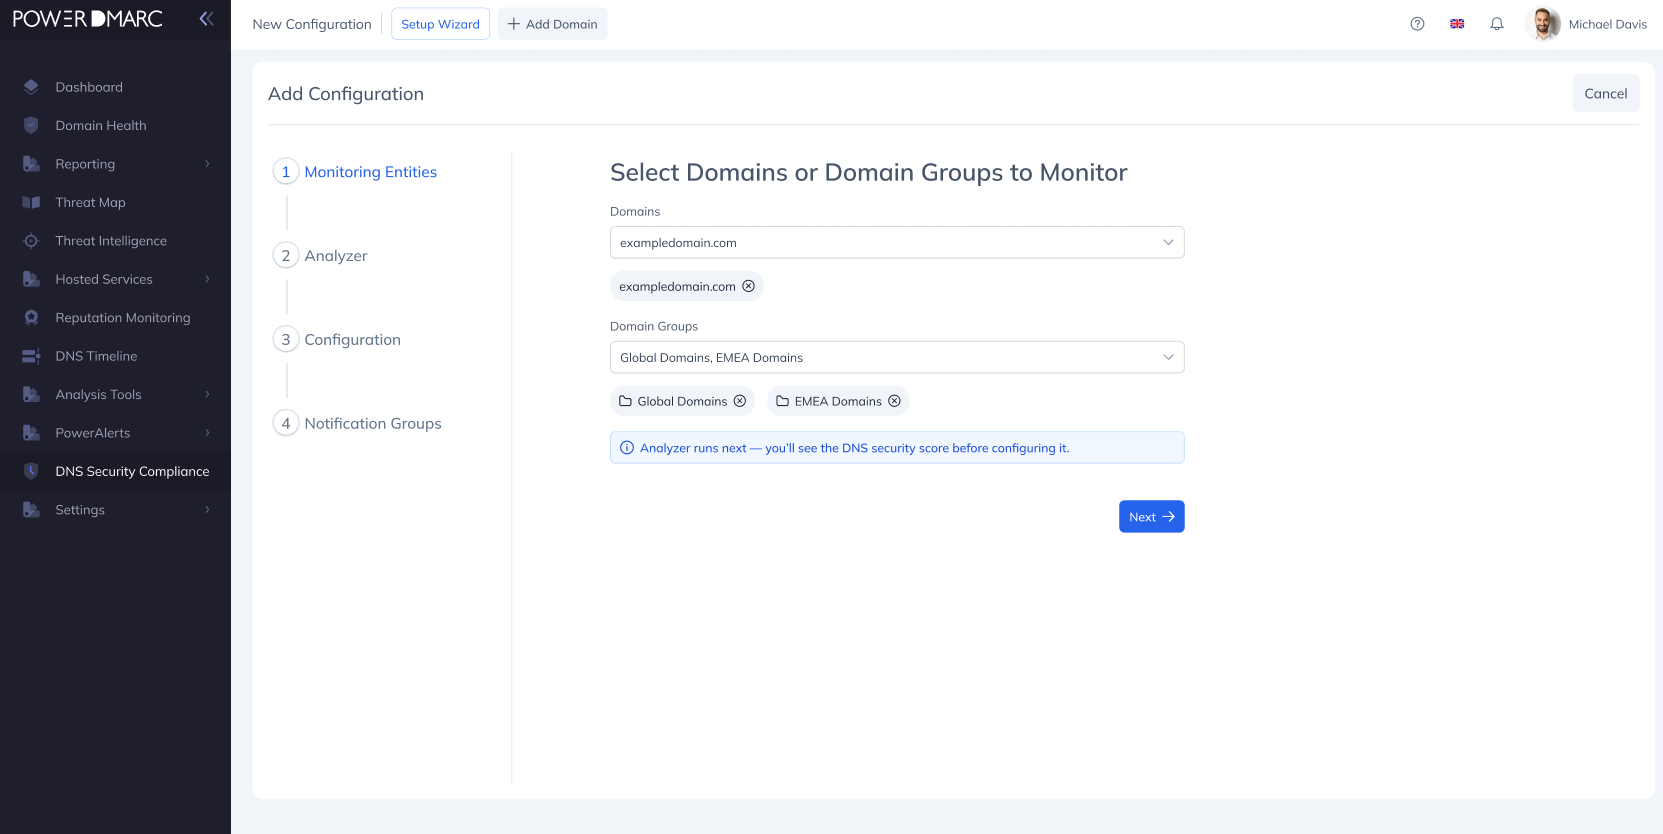
Section heading: Select Domains or Domain Groups to Monitor.
Two independent multi-select dropdowns:
Domains — lists every verified domain and verified subdomain in the account.
Domain Groups — lists every Domain Group configured in the account.
Pick entries one at a time in either or both dropdowns; each selection appears as a removable chip below. There’s no “select all” option — every entry is picked individually. At least one chip is required before Next is enabled.
3. Step 2 — Review the Analyzer Report
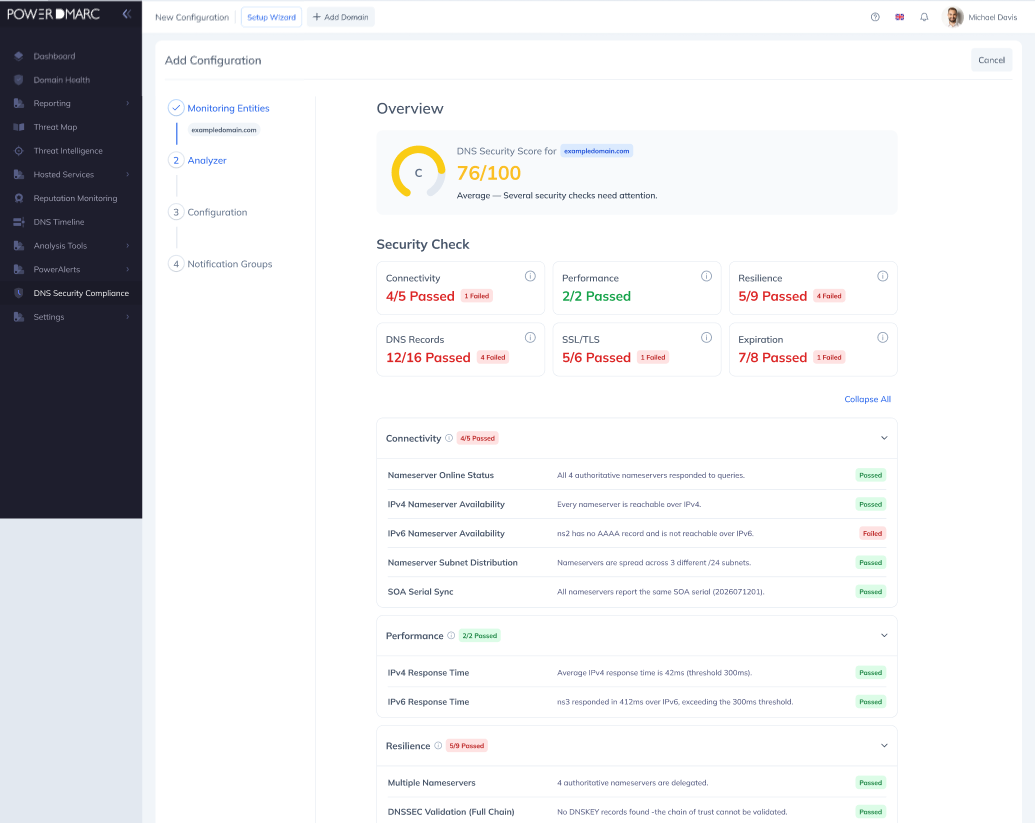
This step only runs when Step 1 contains exactly one Domain and zero Domain Groups. In every other case (multiple Domains, or any Domain Group selected), Analyzer renders as a disabled step — visible in the sidebar, grayed out, unclickable — and clicking Next on Step 1 advances straight to Step 3.
When active, Analyzer runs an on-demand scan for the selected domain and shows the full report inline: an A–F grade card, 6 category cards (Connectivity, Performance, Resilience, DNS Records, SSL/TLS, Expiration), and the detailed check breakdown. This view is read-only within the wizard and doesn’t block progress to Step 3 — it’s there so you can see the domain’s current posture before choosing what to monitor.
4. Step 3 — Select Events to Monitor
Section heading: Select Events to Monitor.
Each event row shows a checkbox, the event name, and a one-line “Fires when” description. Events are grouped into 5 collapsible categories: DNS Record Monitoring, Security Health Checks, SSL Certificate Activity, Registration & Ownership Changes, and Look-Alike Domain Activity.
Ways to build your selection:
Search — the Search by event… field filters events by name (case-insensitive).
Recommended — applies a curated 25-event default set. This overwrites your current selection silently, with no confirmation prompt.
All — ticks every event in the catalog.
None — clears every event. The wizard blocks progress to Step 4 until at least one event is selected.
Custom — not a button; this is a state indicator that appears automatically once your selection no longer exactly matches Recommended, All, or None.
Individual checkboxes — tick a single event.
Group header checkbox — ticks or unticks every event in that group at once. Shows an indeterminate state when only some events in the group are selected.
A live counter updates per group (e.g. “DNS Record Changes 3/4”) and at the page level (e.g. “25/44 Selected”).
5. Step 4 — Assign Notification Groups
Optionally select one or more existing PowerAlerts notification groups to route alerts to. This step can be skipped entirely — Finish is enabled with zero groups selected. Events are still recorded and visible on the Summary tab either way; without a group, they just won’t trigger external notifications.
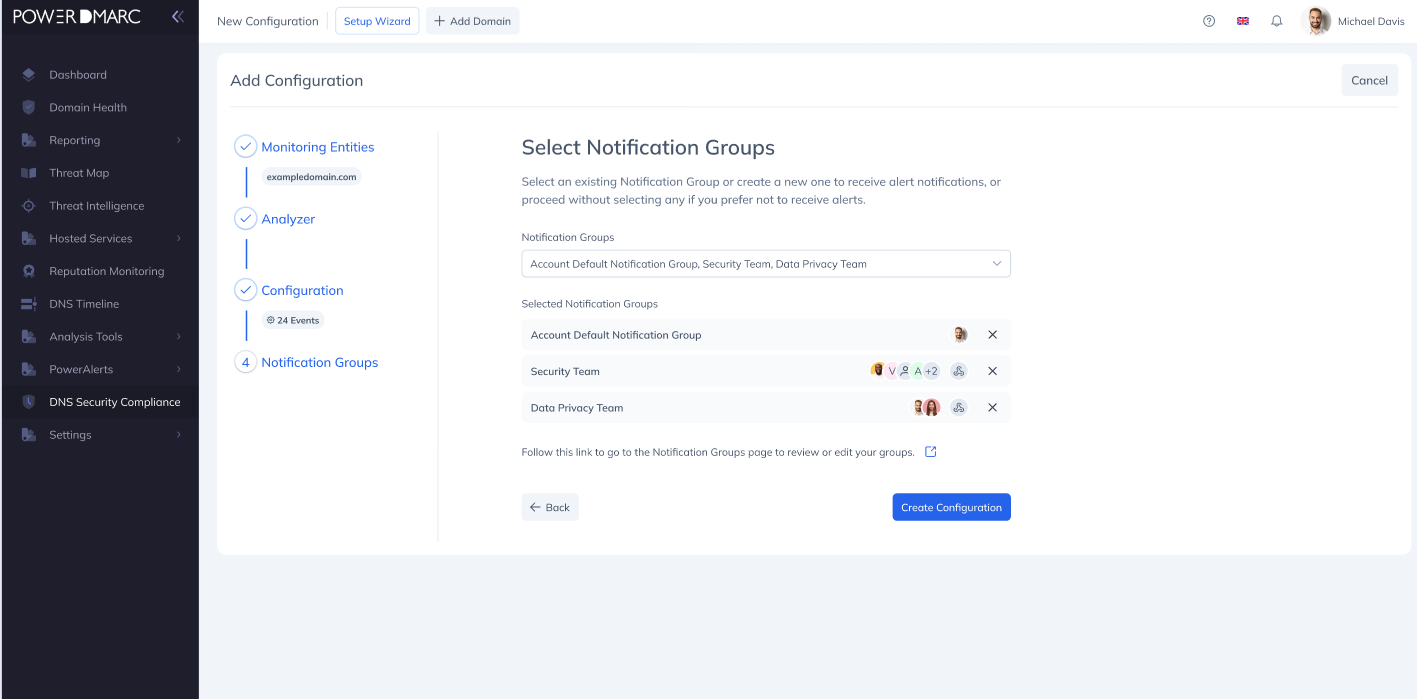
Click Finish to save. Regardless of how many entities you selected in Step 1, exactly one configuration is created, and the chosen events and notification group apply uniformly across all of its entities.
Acceptance behavior to expect:
Picking one Domain and zero Domain Groups activates Analyzer (Step 2).
Picking multiple Domains and/or any Domain Group skips Analyzer and goes straight from Step 1 to Step 3.
As you complete each step, its sidebar badge turns into a green checkmark, and Step 1’s completed entities show as a truncated summary beneath the “Monitoring Entities” label. Clicking a completed step returns you to it for editing without losing later-step selections.
Clicking Cancel (top-right of the wizard) at any point discards the wizard and returns you to the Configuration tab without saving anything.
Managing Existing Configurations
Once at least one configuration exists, the Configuration tab shows a list view instead of the empty state.
Use the search bar to filter by domain or group name, and the All / Enabled / Disabled filter chips to filter by status. The table paginates at 10 rows by default (switchable to 25 or 50).
Editing — every step is mutable in Edit mode, including Step 1 entities.
Deleting — opens a confirmation modal before removing the configuration. Historical events for the affected domains remain viewable even after deletion.
Status toggle — switching a configuration to Disabled pauses scans and event dispatch for all of its entities (with a confirmation prompt); switching back to Enabled resumes both. Historical data is never affected.
Where Configured Data Appears
Once a configuration is created, results start flowing into the Summary tab for the covered domains — current grade, failing checks with recommended fixes, a recent-events feed, and an expiration calendar for certificates and domain registrations. You can also run an on-demand scan for any domain at any time from the Analyzer tab, independent of whether it’s configured for ongoing monitoring.
For further assistance, visit support.powerdmarc.com or contact your PowerDMARC account manager.